Labour’s internal politics of planning
Prior to the recent election, Labour MPs represented seats containing just 15% of England’s Green Belt. That has now risen to 50%.
In a nutshell, that statistic captures the challenge facing Rachel Reeves and Angela Rayner as they embark on a much-needed rethink of planning rules. They have, however, already alighted on a very promising solution - more on that in a moment.
Much has already been written about the width and (lack of) depth of Labour’s new electoral coalition, and nowhere is that truer than on development. Stack’s analysis shows that while the 192 English constituencies retained by Labour from 2019 are well-above-average in their support for local development overall, the 182 they gained from the Conservatives are definitely not, sitting below the national average:
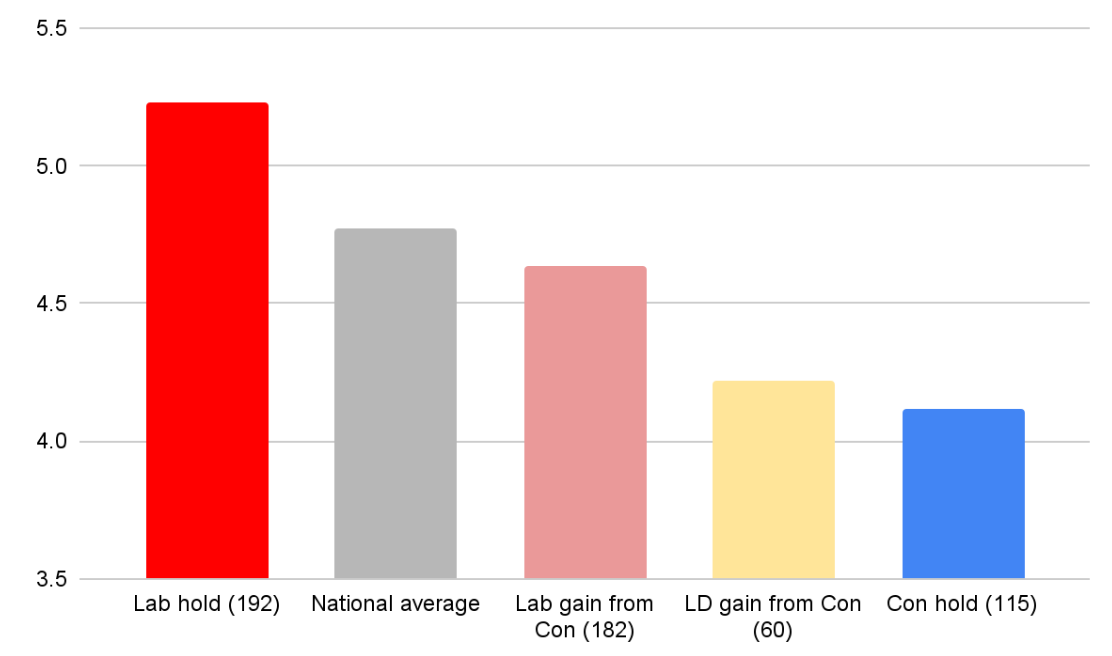
Stack’s composite metric for support draws on tens of thousands of interviews over the past 18 months and balances attitudes to different types of development along with intensity of feeling, to produce a simple score out of 10.
In our polling we also ask about building on different types of land in the respondent’s local area. Nationally, developing local brownfield land enjoys very strong net support (+55%), whereas building on local Green Belt land is opposed by more than support it (-25%).
Labour’s new constituents pose a particular challenge on Green Belt development: across the 182 seats they took from the Conservatives, net support for building on the local Green Belt sits at -39.8%.
But Labour have alighted on an apparently effective way to change the conversation.
When we then ask respondents about building on “grey belt” land (which we describe as “land that has been built on before, like waste land, former landfill or car parks that are technically inside the Green Belt”), support bounces back to once again outweigh opposition (38% net support).
The change in net support from Green Belt to “grey belt” (a shift of +63%) highlights just how effective a piece of communication this new framing is.
And even among those most opposed to development (ie those who answer “Strongly oppose” to “To what extent would you support or oppose more homes being built in your local area?”), the change in support from Green Belt to “grey belt” is +64%. So, whilst NIMBYs are dead-set against building on the local Green Belt, they are clearly persuadable when the land is described in language which reflects its reality.

The Green Belt is not evenly distributed across England: only 328 of 543 constituencies have any Green Belt land, and 80% of Green Belt land is concentrated in just 108 of those constituencies. Of those 108, 56 now have Labour MPs, 40 of which they took from the Conservatives.
So what do people think in these constituencies, where it matters? When we model the reaction to developing the “grey belt” to reflect constituency boundaries, we see an even more pronounced improvement in these 108 constituencies, and particularly in those Labour gained from the Conservatives:
